Argentina Soybean Crush Update


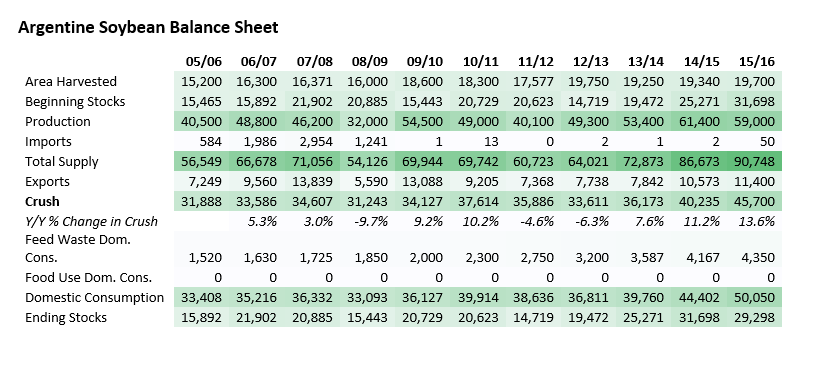
USDA is currently forecasting Argentine soybean crush for the 15/16 marketing year at 45.7 MMT. This is up compared to last year at 40.235 MMT and represents an increase of 13.6% which is the largest year-over-year increase in the past decade. This increase is due to the large production estimate of 59.0 MMT and also the record beginning stocks which are estimated at 31.698 MMT. Beginning stocks and production bring total supply to a record 90.748 MMT. For comparison Brazil’s total 15/16 supply is 119.803 MMT (100 MMT of production and 19.503 MMT of beginning stocks).

Soybean crush in 15/16 would represent 91.7% of Argentina’s domestic demand for soybeans compared to an average of 93.3% since 2005. Crush demand is also 4x larger than export demand which is at 11.4 MMT.

1

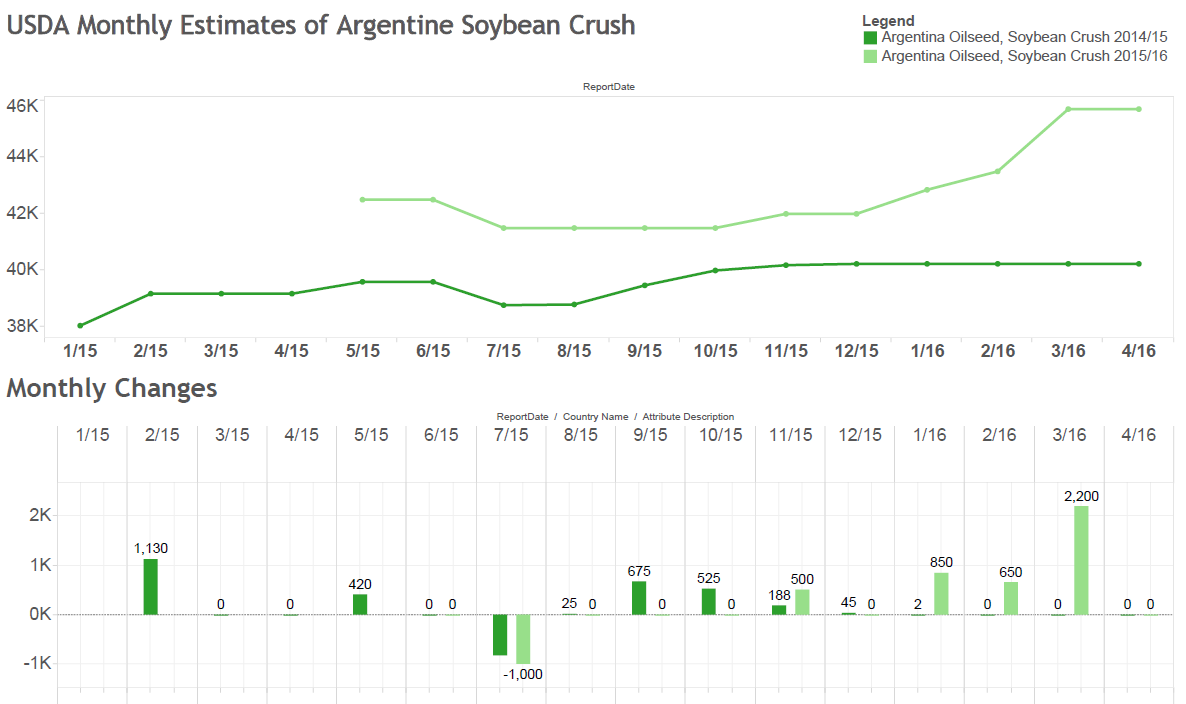
The current USDA estimate for Argentine crush was increased in each of the first 3 months of 2016 but was not changed on the April 12th report. In January 2016 it was increased 850k MT to 42.85 MMT, then again revised 650k MT higher in February, and then lastly increased 2200k MT in March to the current estimate. There haven’t been any changes to the 14/15 estimates since December of 2015


2

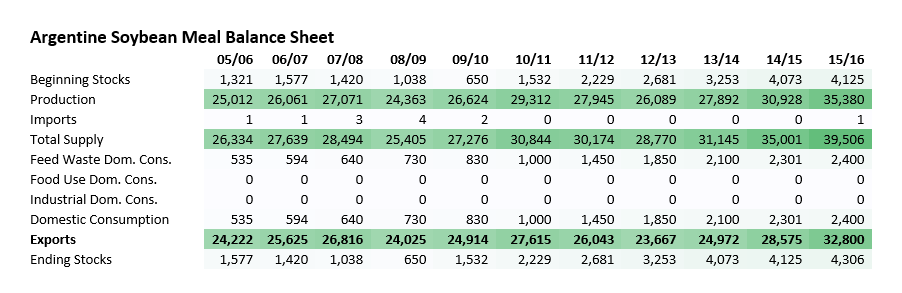
The current soybean meal balance sheet has beginning stocks of 4.125 MMT with meal production of 35.38 MMT. Domestic consumption of meal has been a small but growing part of overall demand and is up 140.0% over the past 5 years. Over that same time period soybean meal exports have grown 18.8%

3

Argentine meal exports go to a diverse set of destinations (pie chart on right) including Europe and Southeast Asia. In 2015 the 10 largest destinations accounted for only 57.2% of total export volume and the 15 largest markets accounted for 70.5% according to numbers published by the National Food Safety and Quality Service (SENASA).

4

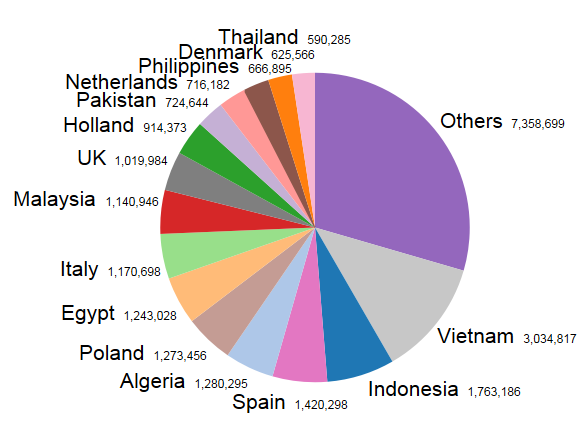
Additionally last year there were 67 countries Argentine shipped meal to where the volume was under 500k MT. Unlike soybean exports where China accounts for the majority of the volume, soybean meal exports in Argentina are spread out a wide range of countries doing relatively small volumes.


Current Crush Situation

Official crushing statistics are tracked by the Ministry of Agroindustry (Ministerio de Agroindustria) which publishes statistics for soybeans, sunflowers, peanuts, canola, and other oilseeds. Their reports also include the related production of oil, meals, and pellets.

The USDA uses an October through September marketing year for soybeans in Argentina. The most recent data through February 2016 has marketing year total crush at 16.53 MMT which is up 30.0% compared to this time last year (12.72 MMT). This is currently the fastest pace of crush on record.

5

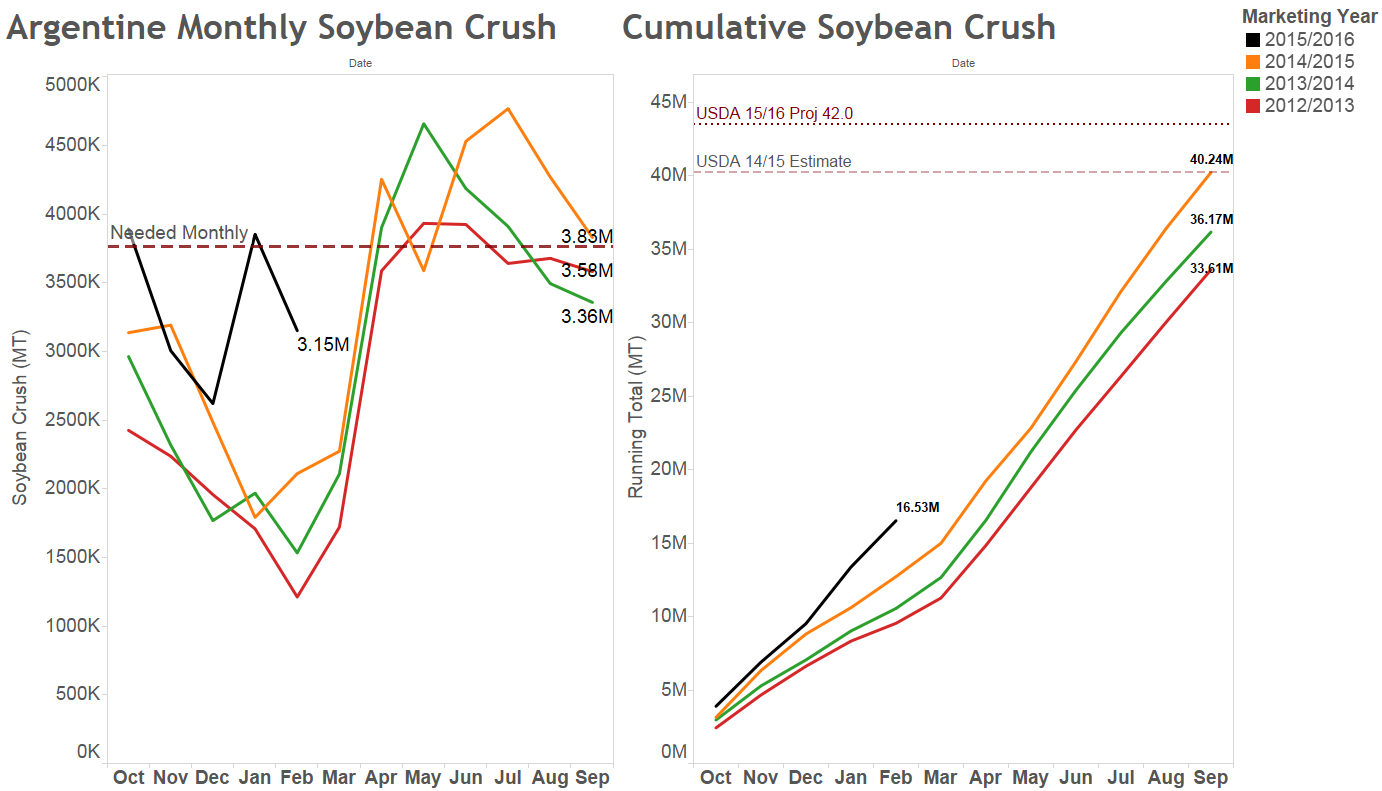
This record pace was helped by January’s crush total of 3.85 MMT after new president Mauricio Macri came to office in December 2015. Prior to 2016 the average crush pace in January was only 2.11 MMT with the prior record of 2.94 MMT set in 2008.

Crush in February was down slightly to 3.15 MMT but was still a record for the month exceeding the prior record of 2.27 MMT set in 2015. Previously the average crush rate in February was 1.78 MMT from 2003 through 2015.


Farmer Selling

After Macri took office there have been new policies that benefited the agriculture sector including devaluation of the peso and eliminations of export taxes on wheat and corn. This led to substantial sales of corn and wheat although farmer selling of soybeans was less than the market anticipated.


Since the removal of taxes the Ministry of Economy and Public Finance has issued export licenses at a record pace for some grains including 17.98 MMT of corn (top chart), 3.45 MMT of feed wheat and 1.77 MMT of barley.

Export licenses of soybean meal are also at a record rate at 7.83 MMT for 2016 and 13.64 MMT since the start of the marketing year in October (lower chart). However compared to other grains the increase in export licenses is much smaller.

6

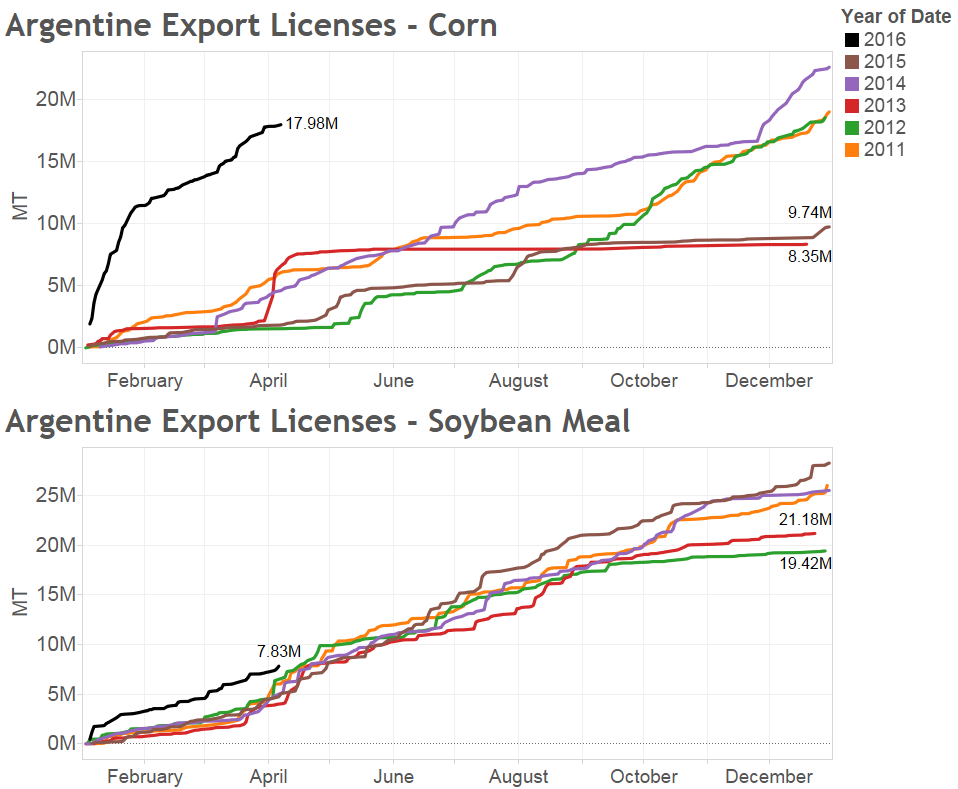
Soybean export licenses are at 2.74 MMT for the year which is about the same pace as 2014 and is below the 2012 pace.


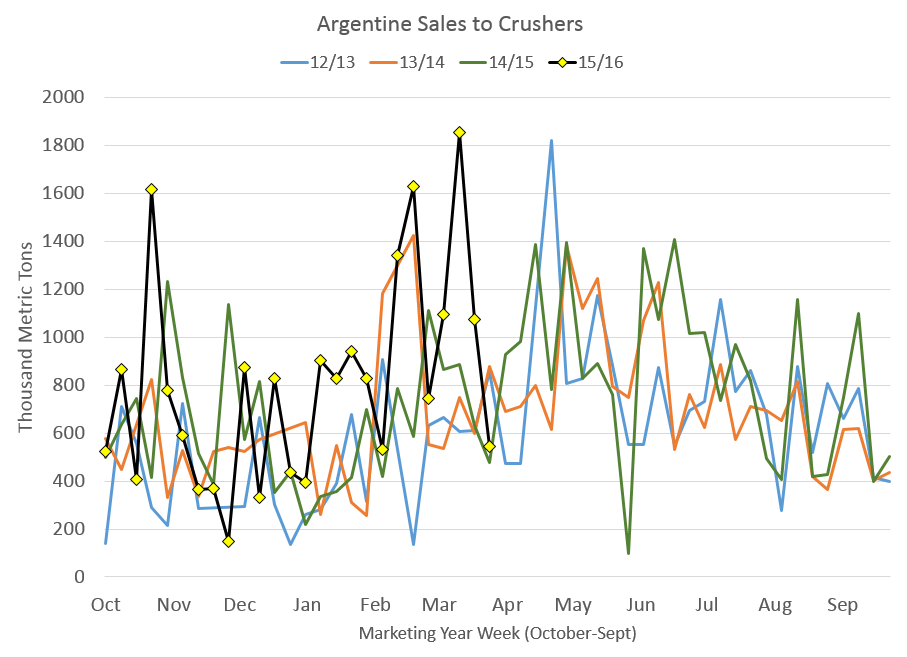
Despite these strong sales in grains the farmer sales of soybeans remained slow but have increased substantially in February and March. The Ministry of Agriculture also tracks soybean sales made to crushing facilities on a weekly basis. These are not as precise as the monthly official crushing statistics but provide an early estimate. Since the start of 2016 sales to crushers have averaged 977k MT per week.

The 15/16 marketing year total sales are now at 20.8 MMT which is up 27.3% compared to last year which was only 16.4 MMT at this time. Based on conversations with producers they were initially slow to sell soybeans and wanted to see how the new policies and reforms happened. It seems they are now more comfortable selling some soybean stocks.
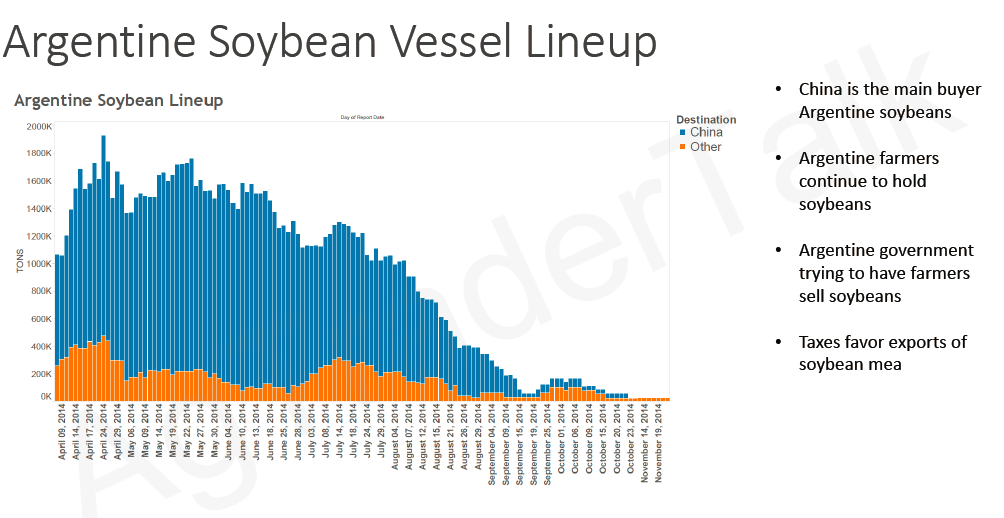
7


Vessel Lineup

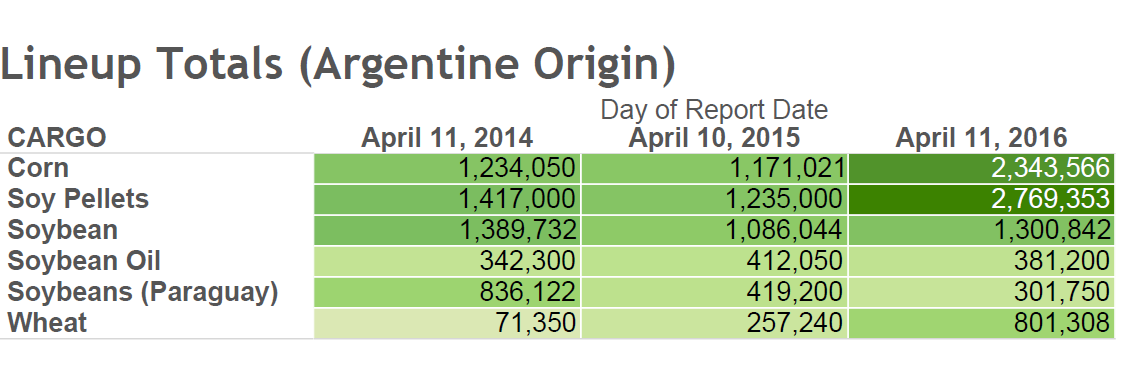
The current vessel lineup for Argentine includes 2.34 MMT of scheduled soybean meal and pellet shipments. This is substantially higher than last year at 1.17 MMT or even 2014 at 1.23 MMT. Additionally corn, wheat, soybean, and soybean oil scheduled shipments are all higher than 2015.

8

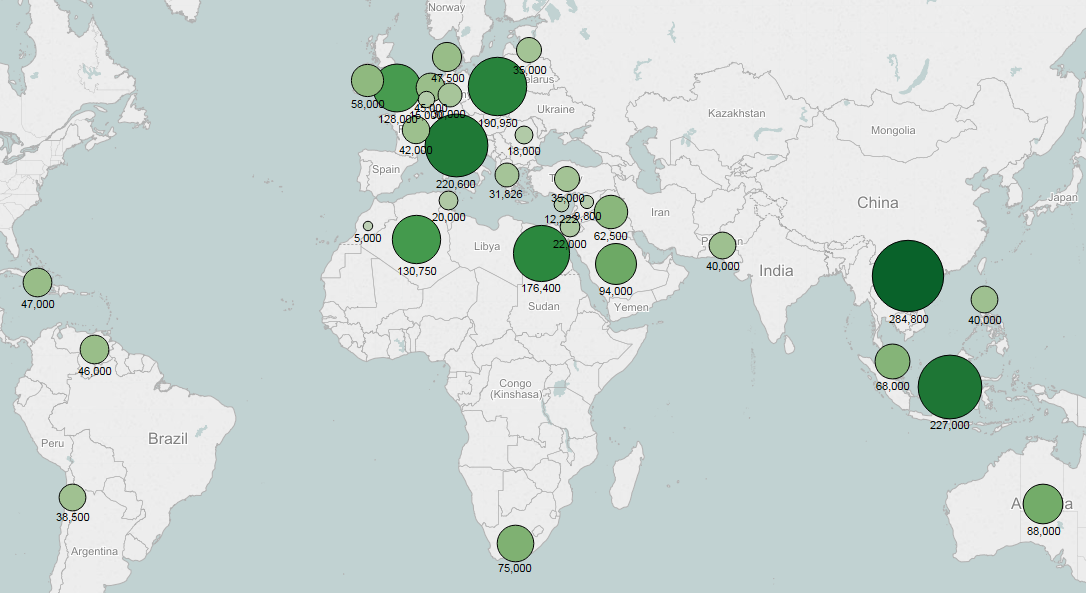
Meal shipments locations are shown in the map below by size and are currently scheduled for 33 destinations primarily in Europe, Southeast Asia and Middle East and North Africa. The 3 largest destinations are Vietnam, Indonesia, and Italy.

9

The lineup for whole, unprocessed soybeans from Argentina is at 1300k MT which is above 2015 levels but below 2014. Additionally there is 423k MT of soybeans from Paraguay and Uruguay scheduled to be shipped from ports in Argentina or Uruguay which brings the regional total to 1723k MT.

10
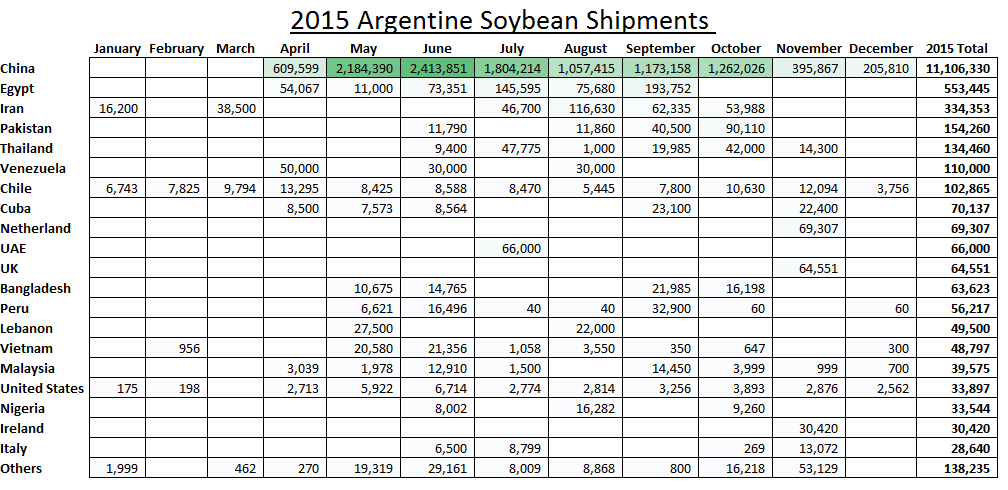
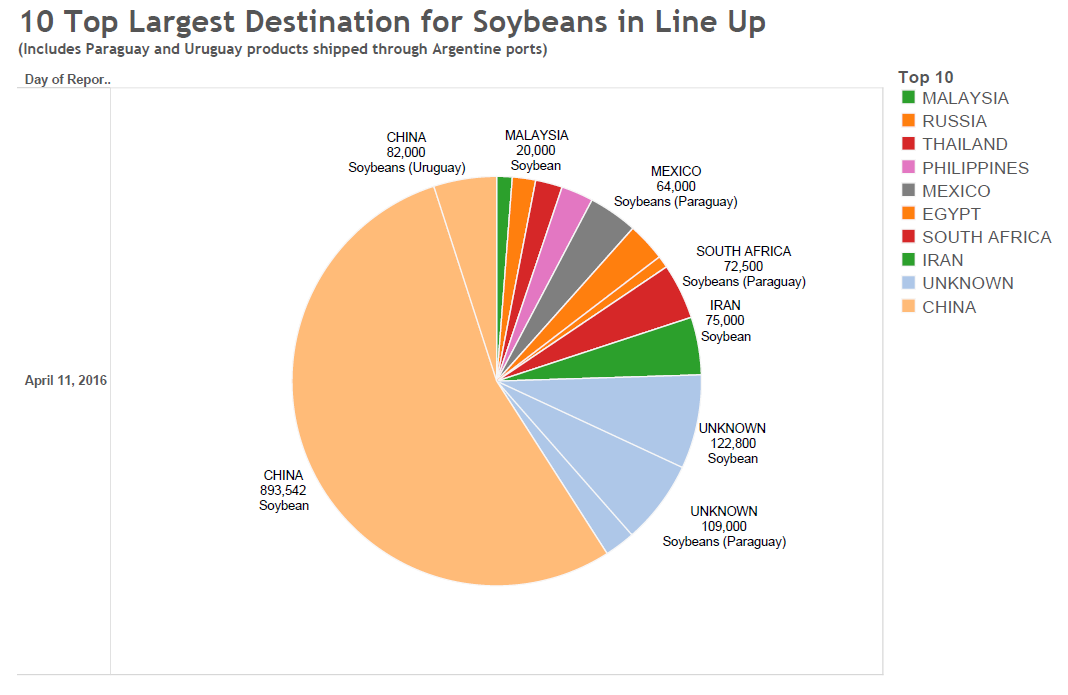
Of that total China accounts for 976k MT (59% of the total). The 2nd largest listed destinations is “Unknown” at 272k MT or 16% of the total. However this might be understating China’s role in whole soybean exports from Argentina. In calendar year 2015 China accounted for 11.11 MMT of the 13.29 MMT total soybean exports, or 83.6% of total soybean exports. The next largest destination was Egypt at only 553k MT.

11


FOB Premiums

Argentine FOB premiums for soybean meal have fallen as the harvest began. Premiums are lower than last year at this time where most months were around $8-9/ton premium to CBOT prices compared to $2-6/ton now. However it’s notable that during March and April the Brazilian meal basis has fallen dramatically more than Argentina. Currently Brazil is around -$30/ton for May and -$20/ton for June.


12


Going Forward

  • USDA is forecasting 15/16 ending stocks at 29.3 MMT which is down 2.4 MMT but is still the 2nd largest Argentine stocks on record. This seems like relatively small stocks liquidation given the large pre-harvest sales to crushers. Will farmers liquidate more than expected if they switch away from soybeans?
  • Argentine crush capacity is estimated at 60 MMT per year. The current forecast of 45.7 MMT is a record but is still only 76% of capacity. Will Argentina be able to expand crushing toward capacity or will it be limited by logistics and shipping issues?
  • If old stocks are liquidated could this cause quality issues with buyers? Government crushing data suggests meal yields are on the low end of the historic range. Will this remain low if stocks are liquidated?

Chinese corn stockpiles

Below is a report we sent to clients on March 1st assessing the situation with Chinese corn stockpiling and potential market impacts. With Tuesday’s announcement of the end of the storage program it seems a good time to share this analysis


_________________________________________________________________________________________

AgTraderTalk Research: Impacts of China’s potential corn policy changes

March 1st, 2016

The big theme to watch in China right now is the potential change in the corn price policy. The latest announcements are that the new policies will come out “soon” in order to be released before spring planting. There isn’t much clarity on what will actually happen and if they will cut the reserve price again or make some other changes to the policy. China has tried some different subsidy programs with smaller crops where the government covers the difference between the market price and a higher reference price but these have been expensive and difficult to manage. Given the large size of the corn crop I think it’s more likely to see a reserve price cut vs a subsidy program, but again it’s very difficult to say.


The futures market continues to price this in with the large spread between the May and September Dalian corn contracts, now trading at $1.06/bushel inverse. It’s also notable that the spread between the September and January contract has come in substantially to only a $0.36 inverse now. Maybe the talk that the reforms will be announced this spring has kept May/Sept at high levels, while weakening Sept-Jan.

1


Despite the large production and ending stocks, China has mostly been isolated from the international corn market. This has been increasing in recent years due to the rejections of US corn and reliance mostly on Ukraine imports. As I mentioned last month although China isn’t importing US corn their high domestic corn price indirectly support other alternative feeds like sorghum, barley, DDGS, cassava, etc… Imports of these could become less attractive if Chinese corn prices fall. And this would indirectly put pressure on feed grains, including corn.

We’ve seen this to some extent with the 15/16 sorghum balance sheet in the US as production increases outpaced export increases. Sorghum production went from 433mbu in 14/15 to 597mbu in 15/16 while exports went from 353mbu to 325mbu. During that same time period Gulf basis for sorghum went from $1.90 to $0.10. So if this happens on a larger scale there will be a lot of feed grain without a buyer and it will need to compete with corn on price.

2


Another example of how this might play out is to look at the situation with Japan. Combined imports of corn, sorghum, DDGS and barley have been falling in recent years.

3
Japan’s marketing year to date corn imports are at 5.0 MMT vs 4.9 MMT last year. However the cumulative import pace of barley/sorghum/DDGS is very low at only 902k MT this marketing year. I’ve included those combined imports on the chart on the left below. Combined barley/sorghum/DDGS exports of 902k MT is the slowest pace since 1988 so this is relatively unprecedented.


USDA attaché noted recently that Japan had difficulty buying sorghum and barley due to China buying most of the exportable supplies from the US and Australia. We’ve seen a similar situation with DDGS where strong buying from China reduces exports to Japan. This has led to the lowest sorghum inclusion in feed on record (3.14%) , and the lowest barley inclusion in feed in 7 years (3.37%). To offset this inclusions of rice have increased, and corn inclusion has gone from 44.04% (10.69 MMT) in 11/12 to 45.04% (10.53 MMT) in 14/15. So although since 11/12 Japanese feed production has fallen 3.6%, the use of corn in feed has only fallen 1.5%.

4

If Chinese corn prices were lower they wouldn’t have been buying barley and sorghum as aggressively. This would mean Japan would be buying their normal mix of feed ingredients, and with decreasing feed production this would mean importing even less corn. This would in turn be more negative for the US corn export situation.


Lastly there were months in 2015 where DDGS exports to China accounted for nearly half of total DDGS production. DDGS imports are a loophole to get around the import controls on corn and are supported by the high domestic price. And due to their high domestic corn prices, China was able to buy DDGS at higher prices than other countries were. This helped support ethanol margins, and as a result, corn demand.

So although China isn’t very involved in the world corn market these policy changes will work their way through the system and would be negative to grain prices depending on how much the domestic prices fall. Unfortunately we don’t have much clarity on the scope or the timing of these changes.


03-01-2016 11-10 AM – AgTraderTalk Research Impacts of China’s potential corn policy changes (1)

USDA Ag Outlook Forum S&D Tables

Corn:

USDA forecasting a 2% increase in production Y/Y with their trendline yield of 168.0 bpa.  Exports seen up 3% Y/Y (+50 mbu) while total demand up 1% Y/Y, largely coming on 125 mbu increase in feed/residual (+2%).  Livestock production would likely need to see larger expansion than currently seen?  At face value, if BRZ doesn’t have a weather event in corn, exports could still be overstated.  Secondary prize for not posting a 2 bil bushel carryout.  Am sure the feed/residual numbers will find arguments as to being too big.  Analysts so far are running around 25 mbu less on F&R than USDA is but that being said, trade is also using a larger export number (1.750 bbu).

14.4% stocks to use in corn would be largest since 17.45% in 2005/06.

Bottom line, USDA fairly aggressive on demand but they’re also assuming lower prices (cure for low prices is low prices).  At 90 mil acres, fairly similar yield returns as last year, means carryout increases largely depend on lack of summer northern hemisphere weather event.


11

Soybeans:
Trendline yield of 46.7 bpa; production down 3% Y/Y.  USDA has crush at 1.900 bbu (trade at 1.890 on avg); exports at 1.825 bbu (trade:  1.777) with demand at 3.850 bbu (trade 3.799) up 4% Y/Y which may seem aggressive given lack of issues in SA.  Y/Y decline in stocks/use at 11.4%.


In beans, aggressive demand estimates and Y/Y declines in carryout but tendency could be for more bean acres (where do wheat acres go if they go?).  If acres are found back, then soybean S&Ds have potential to get very sloppy.  Gut hunch is that bean yield has better potential to beat trend than corn but that isn’t saying much, and still have to be cognizant of potential late summer weather situation.

12


Wheat:

USDA forecasting a 7% Y/Y increase in total demand of which, a 10% Y/Y increase in exports at 850 mbu (note in the what other’s email trade averaged 885 mbu exports) while USDA is more aggressive on feed residual (200 mbu vs trade’s 175 mbu).


47.3% stocks/use down slightly Y/Y.  Would be 9th largest since 1970.  13


Brazil Vessel Lineup and Shipments

For the past week Brazil shipped 280k MT meal/pellets, 752k MT of corn, and 621k MT of soybeans.

Soybean shipments are up dramatically vs last week at 262k MT and this is the highest levels since September 28th. Soybeans in the lineup have also increased sharply over the past week to 8.7 MMT vs 5.8 MMT last week.

Corn shipments continue to be strong however the lineup has fallen to 1.8 MMT vs 3.6 MMT last week. USDA raised their 14/15 corn export number to 33 MMT on last week’s report but according to lineup data shipments are still 1.68 MMT higher at 34.7 MMT for the marketing year. USDA did also raise their 15/16 estimate from 25.5 to 28 MMT so some of these strong shipments late in the marketing year might be accounted for on the 15/16 balance sheet depending on how delayed the Brazilian customs data is.

Paranagua wait time is out to 45 days now.


4 3 2 1