AgTraderTalk interactive charts allow for easy access to a vast library of fundamental grain data. From US export sales and inspection, Brazilian customs data, Argentine vessel loadings, USDA supply and demand forecasts, and much more.
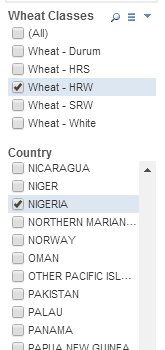
Easily customize your analysis with just a few clicks. Select multiple countries or commodities and the charts will seemlessly refresh to show the new selections. Or look at totals while excluding specific countries or time periods.
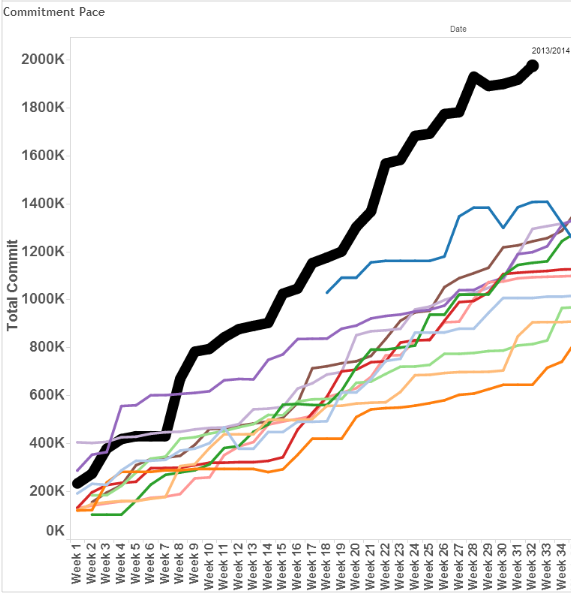
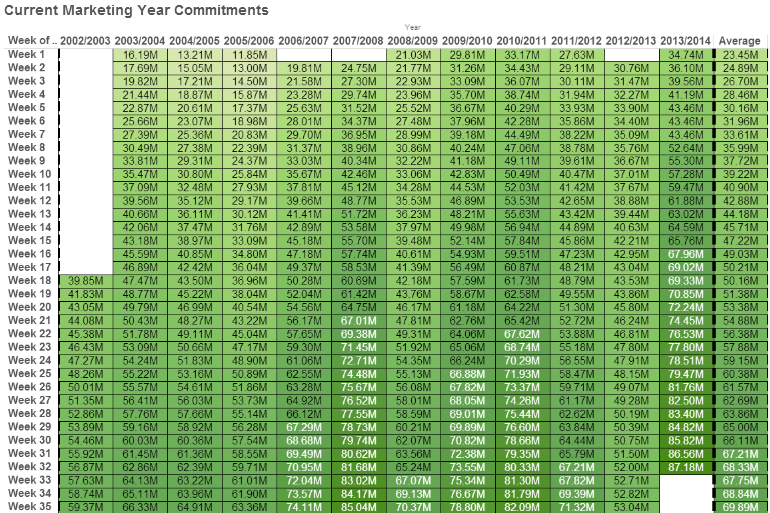
Pick up on changes in supply and demand before the market. Save time by not downloading, formatting and organizing data every week, and get access to data that you didn’t track before. Just login from any browser, pick your country and commodity and instantly get years of historical data arranged so you can easily spot changes and trends.
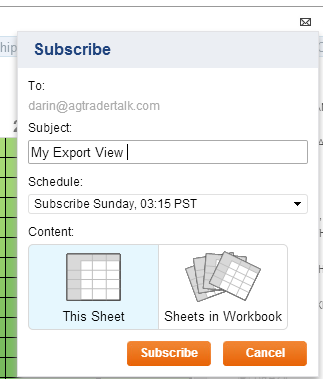
Want to be updated on data even when you’re busy and might not have time to login? Select the data you want to receive and simply subscribe to it. AgTraderTalk maintains and updates all the data so each week the charts will automatically be updated.
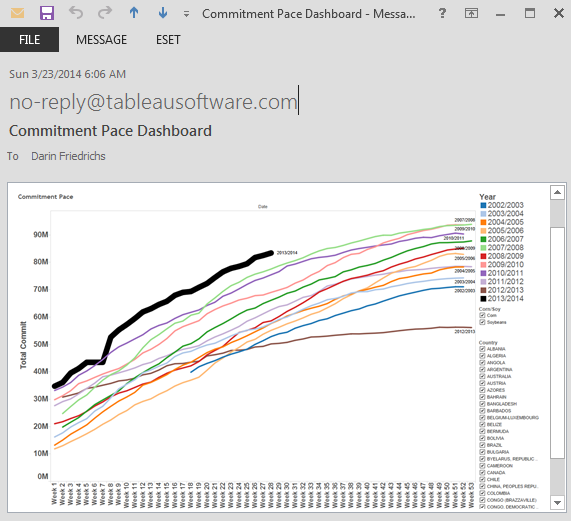
A view of your custom chart or analysis will be delivered directly to your inbox. Click the chart to be taken to that specific chart in your browser to do additional analysis or change settings.
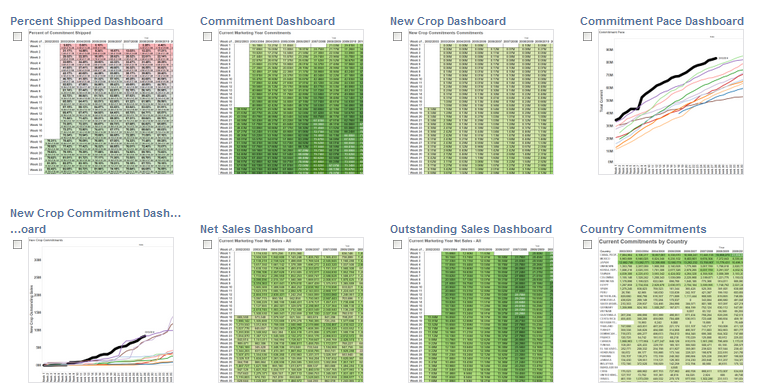
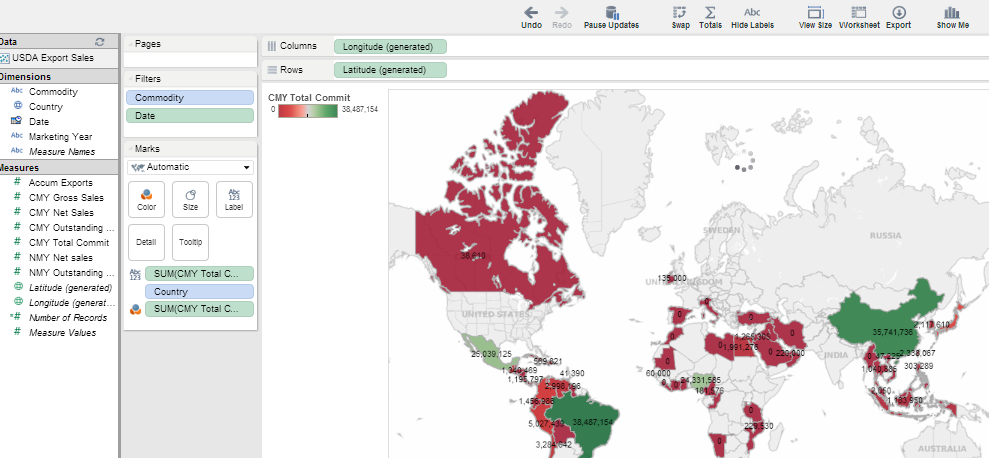 Since the data is always available in the cloud, more advanced users can create their own, completely custom data visualizations. Once saved they will automatically update each week when new data is released.
Submit information below for a free trial